Skip to content
Novus Data— home

Index · method v0.2

Mancalë Index

Is the news about a shipping chokepoint louder or quieter than the ships passing through it justify? Measured each week for seven chokepoints, against a fixed 2019–22 normal.
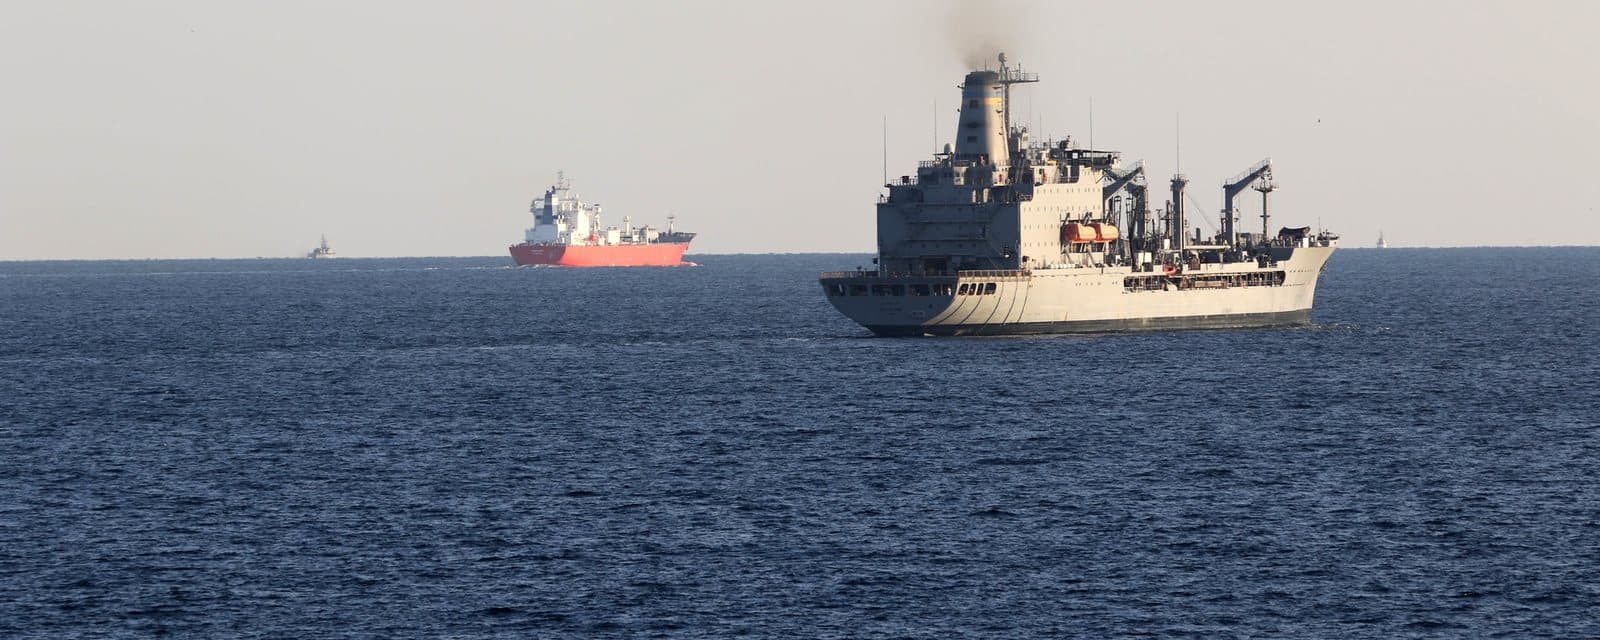
A grey Military Sealift Command oiler at sea, with a red-hulled tanker beyond it, in the Strait of Hormuz
The Military Sealift Command oiler USNS Leroy Grumman transits the Strait of Hormuz, with another ship ahead of it. File photo, December 2020.Photo: Mass Communication Specialist 2nd Class Indra Beaufort, U.S. Navy (source), Public domain (work of the US federal government). Cropped from the original.

Week of

This week

Ship data through . Against the 2019–22 normal. A gap of +2 or more means the news is ahead of the ships; −2 or less, the ships are ahead of the news.

Sources: International Monetary Fund, PortWatch, retrieved 21 October 2026; The GDELT Project, retrieved 21 October 2026. Weekly averages and scores calculated by Novus Data.

How to read it

Two scores and the gap between them

  1. Flow stress, 0 to 6. How unusually few ships passed through the chokepoint that week, compared with its normal. Only traffic below normal counts.

  2. Attention, 0 to 6. How unusually much of the world’s English-language news mentioned the chokepoint that week, compared with its normal. Only coverage above normal counts.

  3. The gap is attention minus flow stress. For both scores, 0 is normal, 2 is clearly abnormal and 6 is extreme.

Gap −2 or less

Ships ahead of news

Ship traffic is far more disrupted than the coverage suggests. The ships are ahead of the news.

Gap −2 to +2

Aligned

Coverage and ship traffic are about equally unusual. The news and the ships tell the same story.

Gap +2 or more

News ahead of ships

Coverage is far more unusual than the ship traffic. The news is louder than the ships justify.

A week where both scores are below 1 is labelled quiet. Where news volume has not been collected yet, the week is described by ship traffic alone and has no gap.

The seven chokepoints, weekly since 2019

Aligned

Strait of Hormuz

Week of 12 October 2026: 3.7 ships a day, −95% against a normal of 80.9; news coverage 97× its normal. Gap −0.87. Aligned for 33 weeks.

Ship transits, % of the 2019–22 normal

Strait of Hormuz: ship transits each week from 31 Dec 2018 to 12 Oct 2026. In the latest week, 3.7 a day, −95% against normal. Lowest week: 16 Mar 2026, −98%.

News coverage, multiple of its 2019–22 normal (log scale)

Strait of Hormuz: news coverage each week as a multiple of normal. Latest week: 97×. Loudest week: 06 Apr 2026, 796×.

Mancalë gap: attention minus flow stress

Strait of Hormuz: the gap each week. Latest week: −0.87. Highest: +4.31 in the week of 15 Jul 2019. Lowest: −1.74 in the week of 28 Jan 2019.

Read with care: PortWatch counts ships from their location signals. In a conflict zone many ships switch them off, so a collapse in counted transits can overstate the fall in real traffic.

Aligned

Red Sea / Bab el-Mandeb

Week of 12 October 2026: 26.4 ships a day, −54% against a normal of 57; news coverage 19× its normal. Gap −0.65. Aligned for 6 weeks.

Ship transits, % of the 2019–22 normal

Red Sea / Bab el-Mandeb: ship transits each week from 31 Dec 2018 to 12 Oct 2026. In the latest week, 26.4 a day, −54% against normal. Lowest week: 14 Sept 2026, −57%.

News coverage, multiple of its 2019–22 normal (log scale)

Red Sea / Bab el-Mandeb: news coverage each week as a multiple of normal. Latest week: 19×. Loudest week: 08 Jan 2024, 135×.

Mancalë gap: attention minus flow stress

Red Sea / Bab el-Mandeb: the gap each week. Latest week: −0.65. Highest: +5.85 in the week of 18 Dec 2023. Lowest: −4.73 in the week of 08 Dec 2025.

Read with care: The news query needs a shipping word next to "Red Sea" or "Bab el-Mandeb", so coverage of the Red Sea in other contexts does not count.

Ships normal

Suez Canal

Week of 12 October 2026: 44.3 ships a day, −20% against a normal of 55.5. News volume has not been collected for this chokepoint yet.

Ship transits, % of the 2019–22 normal

Suez Canal: ship transits each week from 31 Dec 2018 to 12 Oct 2026. In the latest week, 44.3 a day, −20% against normal. Lowest week: 22 Mar 2021, −64%.

Read with care: Most Suez traffic also passes Bab el-Mandeb, so the two readings usually move together.

Ships disrupted

Panama Canal

Week of 12 October 2026: 27.7 ships a day, −15% against a normal of 32.4. News volume has not been collected for this chokepoint yet. Ships disrupted for 5 weeks.

Ship transits, % of the 2019–22 normal (1 week above 130% drawn at the top)

Panama Canal: ship transits each week from 31 Dec 2018 to 12 Oct 2026. In the latest week, 27.7 a day, −15% against normal. Lowest week: 22 Jan 2024, −44%.

Read with care: The canal authority sets daily slots and draft limits, and a change to either moves traffic directly. Its advisories explain most changes in this series.

Aligned

Taiwan Strait

Week of 12 October 2026: 227.3 ships a day, −9% against a normal of 250.5; news coverage 0.4× its normal. Gap −1.21. Aligned for 2 weeks.

Ship transits, % of the 2019–22 normal (1 week above 130% drawn at the top)

Taiwan Strait: ship transits each week from 31 Dec 2018 to 12 Oct 2026. In the latest week, 227.3 a day, −9% against normal. Lowest week: 20 Oct 2025, −39%.

News coverage, multiple of its 2019–22 normal (log scale)

Taiwan Strait: news coverage each week as a multiple of normal. Latest week: 0.4×. Loudest week: 01 Aug 2022, 47×.

Mancalë gap: attention minus flow stress

Taiwan Strait: the gap each week. Latest week: −1.21. Highest: +3.75 in the week of 01 Aug 2022. Lowest: −4.81 in the week of 20 Oct 2025.

Read with care: A very busy lane whose traffic dips around holidays and in typhoon season. The index is not seasonally adjusted, so a short dip with no news is usually seasonal.

Ships above normal

Strait of Malacca

Week of 12 October 2026: 215.1 ships a day, +28% against a normal of 168.3. News volume has not been collected for this chokepoint yet. Ships above normal for 6 weeks.

Ship transits, % of the 2019–22 normal

Strait of Malacca: ship transits each week from 31 Dec 2018 to 12 Oct 2026. In the latest week, 215.1 a day, +28% against normal. Lowest week: 19 Jul 2021, −22%.

Read with care: Flow stress counts only traffic below normal, so a busier strait scores zero. A lasting shift from the 2019–22 level can reflect a change in tracking coverage as well as in trade.

Ships severely disrupted

Bosporus

Week of 12 October 2026: 46.6 ships a day, −53% against a normal of 98.4. News volume has not been collected for this chokepoint yet.

Ship transits, % of the 2019–22 normal

Bosporus: ship transits each week from 31 Dec 2018 to 12 Oct 2026. In the latest week, 46.6 a day, −53% against normal. Lowest week: 28 Sept 2026, −61%.

Read with care: A lasting shift from the 2019–22 level can reflect a change in tracking coverage as well as in trade. Treat a high reading here with more caution than a sudden one.

Method v0.2

How it is calculated

Inputs
Ship traffic is the mean number of vessels crossing each chokepoint per day, by week, from IMF PortWatch, which counts ships from their location signals. News volume is the mean daily share of all English-language news monitored by the GDELT Project that matches each chokepoint’s query, by week. Weeks run Monday to Sunday.
Normal
Every week ending on or before 31 December 2022. It is fixed: it is never re-estimated, so a long disruption cannot gradually become the new normal.
Scores
Each week is compared with normal using the median and the median absolute deviation (×1.4826), which a few extreme weeks cannot drag about. News is compared on a log scale. Flow stress counts only traffic below normal and attention only coverage above it; both are capped at 6. The scale cannot fall below 3% of normal traffic, or 0.15 log units of news, so a very steady series cannot make a small change look large.
Labels
  • News ahead of ships. Coverage is far more unusual than the ship traffic. The news is louder than the ships justify.
  • Aligned. Coverage and ship traffic are about equally unusual. The news and the ships tell the same story.
  • Ships ahead of news. Ship traffic is far more disrupted than the coverage suggests. The ships are ahead of the news.
  • Quiet. Neither coverage nor ship traffic is unusual.
  • Ships normal. No news volume collected yet. Ship traffic is within its normal range.
  • Ships disrupted. No news volume collected yet. Ship traffic is clearly below normal.
  • Ships severely disrupted. No news volume collected yet. Ship traffic is far below normal.
  • Ships above normal. No news volume collected yet. Ship traffic is clearly above normal, which can mean ships diverted here from elsewhere.
What it is not
It describes; it does not forecast. Ship counts are modelled from location signals and undercount ships that switch them off. The news measure counts articles that mention a place, including in passing. The index is not seasonally adjusted. The thresholds are judgement calls, published here so they can be checked. The figures are refreshed weekly; if they fall more than 21 days behind, this page says so.
Mancalë is Quenya, one of J. R. R. Tolkien’s Elvish languages, for “commerce”. Novus Data publishes analysis and commentary, not investment advice.

Scorecard

Do the labels tell you anything about what comes next?

The index describes the week; it does not forecast. The scorecard checks that in the open, with every call listed and the misses left on the page.