Article
Spot box rates are 2.6 times last year's; carriers' rates lag
Drewry's index stood at $4,351 per 40ft container on 8 October 2026, against $1,651 a year earlier, while Hapag-Lloyd's realised rate rose about 9% in the second quarter.
What happened
The Drewry World Container Index (WCI), a weekly measure of spot rates on eight East-West routes, fell 2% to $4,351 per 40ft container on 8 October 2026, according to Drewry's assessment as reported by DCN. On 9 October 2025 the same index was $1,651, after 17 straight weekly declines and at its lowest since January 2024, according to MTS Insights. Since early August 2026 it has stayed between $4,297, on 6 August, and $4,526, on 20 August, according to MTS Insights summaries of 6 August and 20 August.
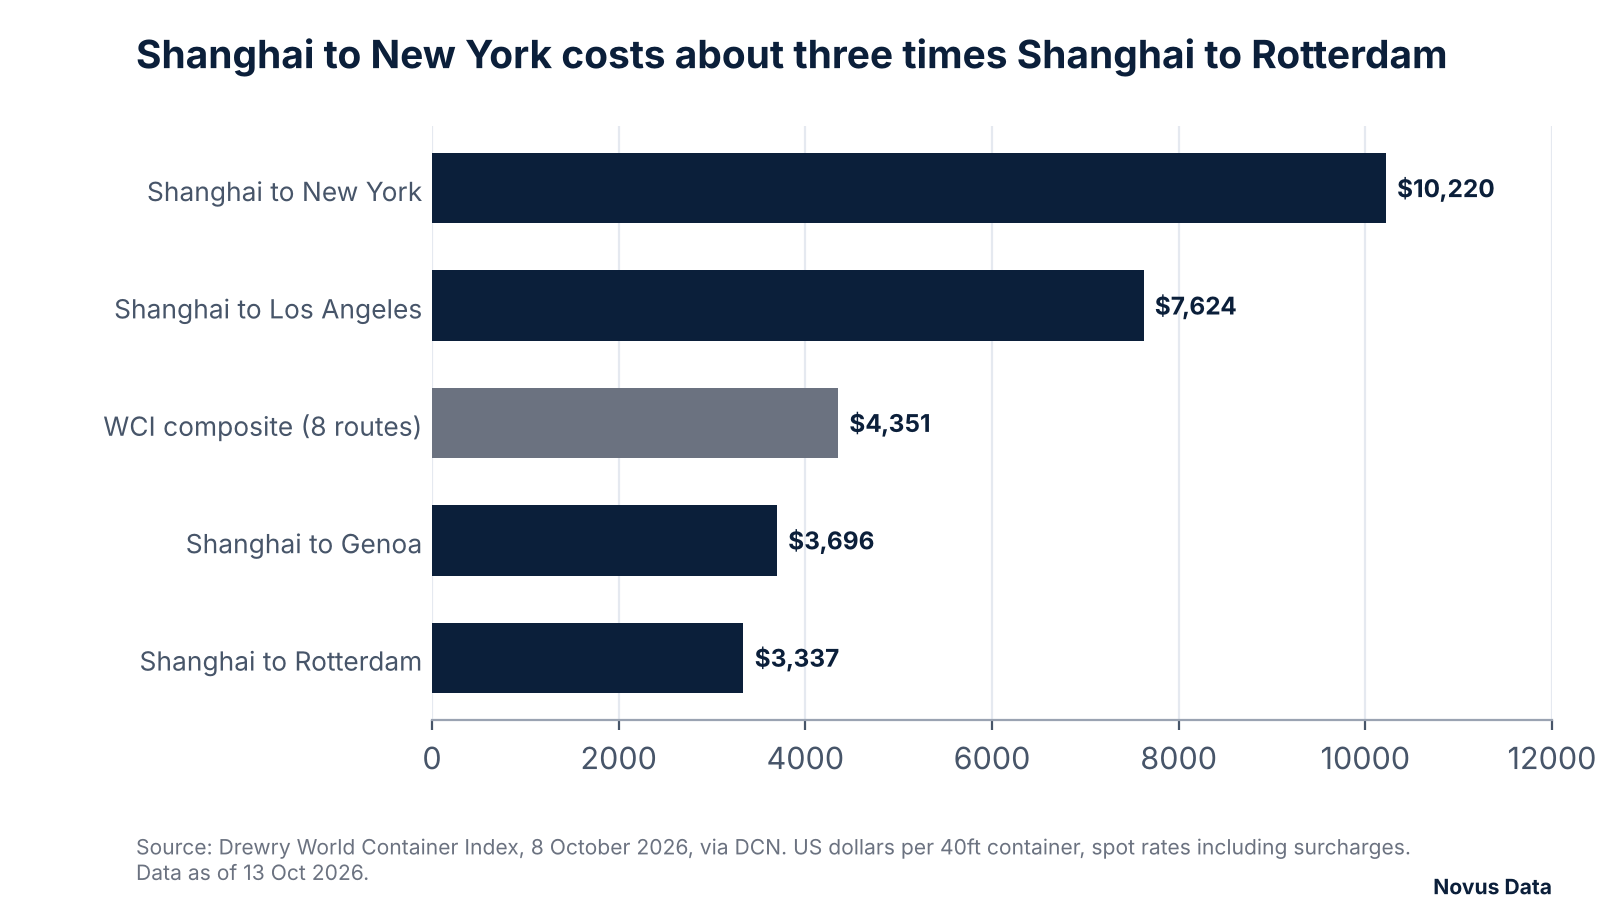
The average hides a wide spread. On 8 October a 40ft container from Shanghai to New York cost $10,220 on the spot market, and Shanghai to Los Angeles $7,624. Shanghai to Rotterdam was $3,337 and Shanghai to Genoa $3,696. A week earlier, Drewry said Asia-Europe rates had fallen for 12 consecutive weeks, and that "increasing vessel transits through the Suez Canal are adding effective capacity to the trade", according to DCN.
Carriers' own figures moved far less. Hapag-Lloyd reported an average freight rate of $1,475 per twenty-foot equivalent unit (TEU) in the second quarter of 2026, up from $1,354 a year earlier, in its half-year report of 13 August 2026. Its first-half average was $1,406, almost unchanged from $1,411. A.P. Moller-Maersk said the same day that its average loaded freight rate rose 22% in the second quarter, and raised its full-year forecast for underlying EBITDA to $10.5 billion to $12.5 billion, from $8 billion to $10 billion.
Why it matters
The WCI and a carrier's average rate measure different things. According to Drewry's methodology, the WCI records agreed short-term spot rates for cargo moving now or within weeks, in dollars per 40ft container, including main surcharges such as bunker charges, weighted by volume on each route. A carrier's average covers every trade it serves, is quoted per TEU (half a 40ft box), and blends spot cargo with cargo moving under contracts agreed earlier. The two cannot be compared in level; only their direction and speed can.
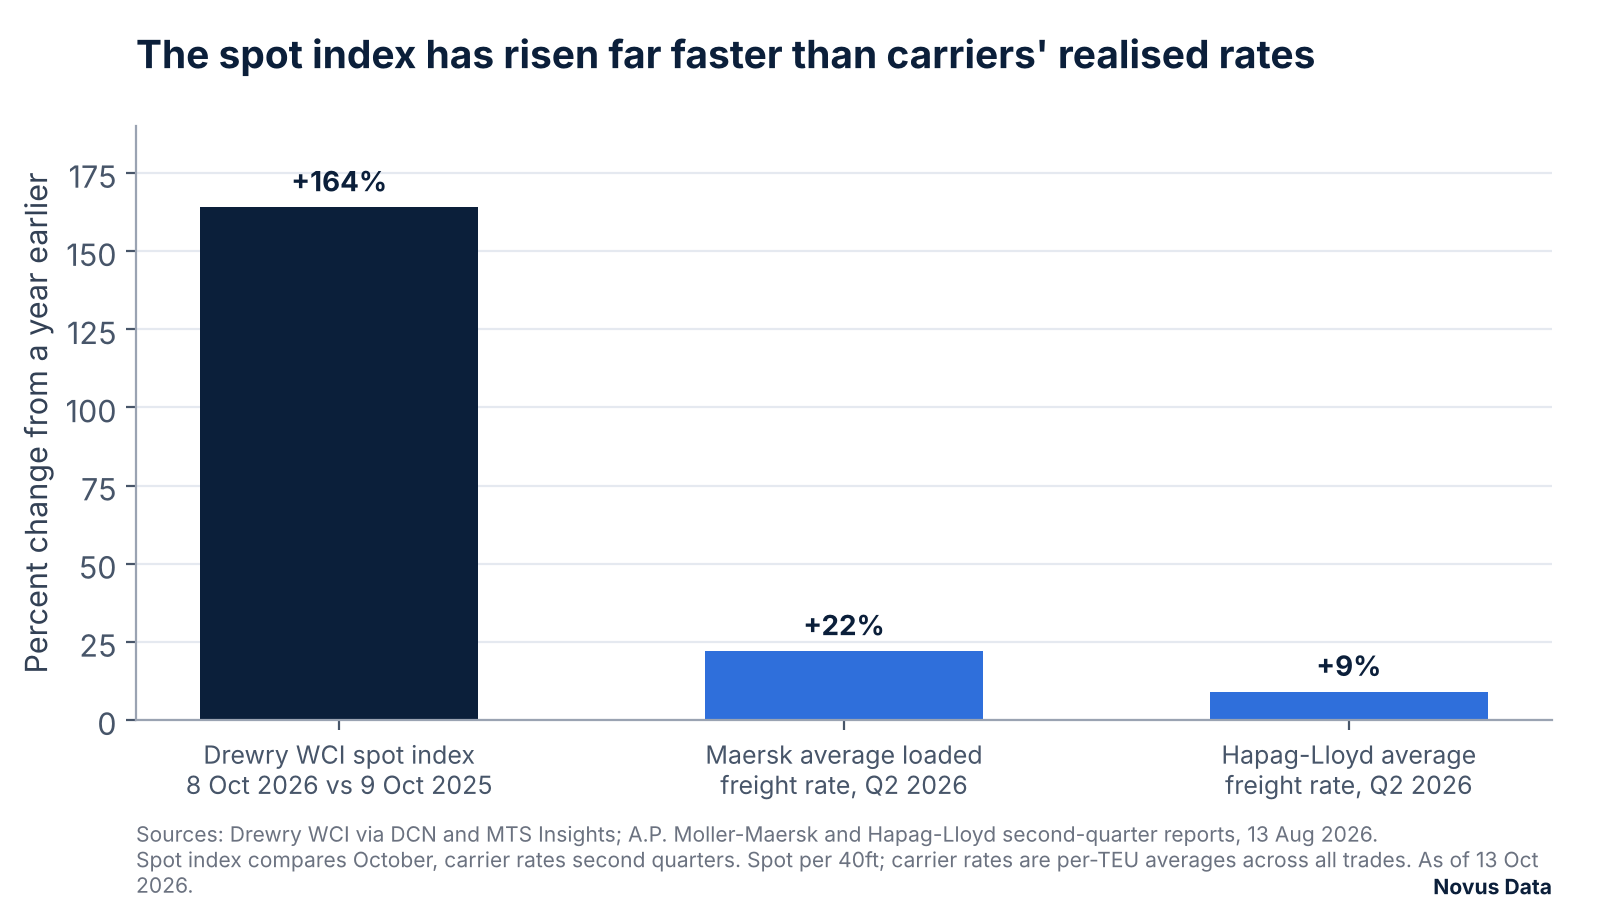
That blend likely explains much of the lag (inferred). Cargo moving under contracts agreed when spot rates were lower keeps paying those prices until the contracts are renegotiated, so a spot rally reaches a carrier's revenue slowly and only in part (inferred). The gap is likely to narrow as annual contracts are repriced (inferred).
Higher rates have not meant higher profits everywhere. Hapag-Lloyd's first-half operating profit (EBIT) fell to $18 million from $677 million. The company cited higher transport costs after "the effective closure of the Strait of Hormuz from the end of February", along with reroutings and longer transit times.
Who it reaches
Importers booking transpacific cargo on the spot market (sector). They pay current rates: $10,220 per 40ft from Shanghai to New York on 8 October 2026. Confidence: reported for the rate, inferred for who pays it. Source: Drewry WCI via DCN.
Asia-Europe importers (sector). Spot rates on these routes fell for 12 weeks to 1 October, which Drewry linked to weak demand and added Suez capacity. Confidence: reported. Source: Drewry WCI via DCN.
Hapag-Lloyd (company). Its realised rate rose about 9% year on year in the second quarter, but first-half EBIT fell to $18 million as Middle East disruption raised costs. Confidence: reported. Source: Hapag-Lloyd half-year report, 13 August 2026.
A.P. Moller-Maersk (company). Its average loaded freight rate rose 22% in the second quarter, and full-year guidance was raised. Confidence: reported. Source: Maersk, 13 August 2026.
What would change this view
- The weekly index. Drewry publishes the WCI each Thursday. A fall well below $4,297, the August low, would show the summer level was not holding.
- Third-quarter results. If carriers' realised rates rise faster than in the second quarter, contracts are repricing sooner.
- Blank sailings. Drewry's cancelled sailings tracker shows whether carriers are still removing capacity to support rates.
Sources
- World Container Index, 8 October 2026. Drewry, via DCN. link
- World Container Index, 1 October 2026. Drewry, via DCN. link
- Drewry World Container Index: Week of October 9th. MTS Insights, 9 October 2025. link
- Drewry World Container Index: weeks of 6 and 20 August 2026. MTS Insights. 6 August, 20 August
- World Container Index methodology. Drewry. link
- Investor Report H1 2026. Hapag-Lloyd, 13 August 2026. link
- Maersk delivers strong Q2 and raises full-year guidance. A.P. Moller-Maersk, 13 August 2026. link
Novus Data publishes analysis and commentary, not investment advice. Nothing here is a recommendation to buy or sell any security.
The Novus Data Briefing
Get the next briefing by email
Delivered by email. Free.